Accessible Powerpoint Presentations
Check your document for accessibility
Note: the example in these steps uses Microsoft Word, but the steps also apply to PowerPoint and Excel. Get more info on Microsoft's accessibility checker.
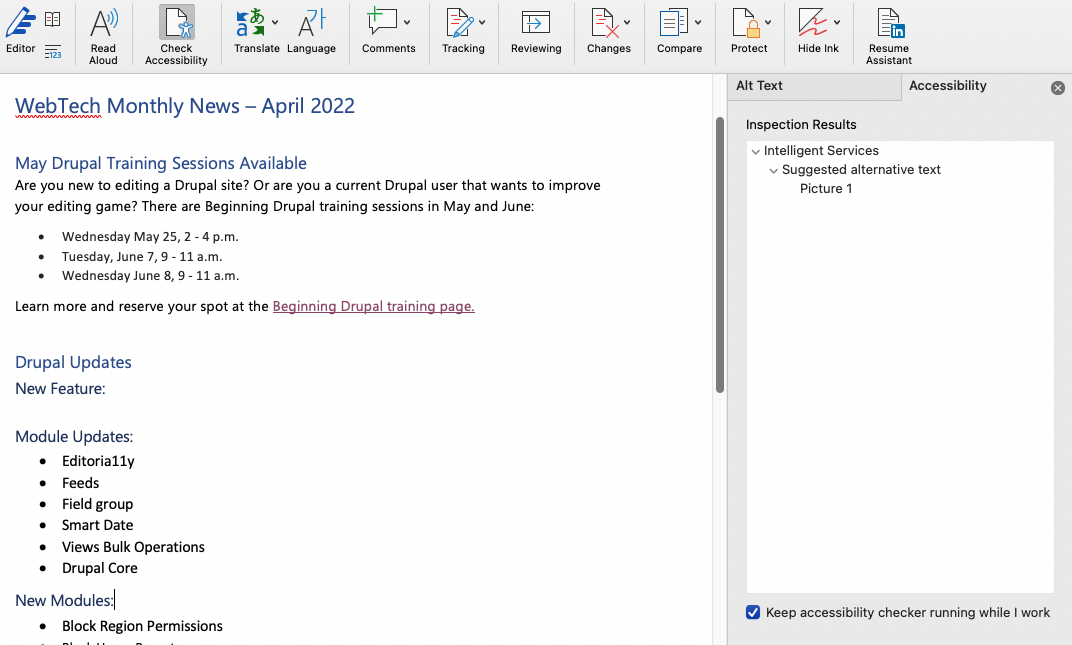
- In the Review tab, choose "Check Accessibility" from the Check Accessibility group.
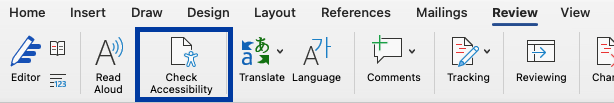
- An accessibility pane will open, with any errors or warnings to investigate. Use the pane to learn more about an issue and how to fix in the Microsoft product you're using.


Building structure
To switch to "Outline" view, go to the View tab at the top of the screen. Select Outline View from the “Presentation Views” group.
In a panel at the left of the PowerPoint window, you will see the outline of your presentation, slide by slide.
As with any other document, the foundation for accessibility in your PowerPoint presentation file lies in the outline of the file. To better understand how you can build structure into your presentation, work with PowerPoint in “Outline” view.
Use standard layouts
With layouts, content is entered in a placeholder. Screen readers will have an order and structure to follow as they advance through each slide.
Use a Standard Layout to produce columns of text as well.
If you put two or more columns of text on a slide, use either the “Two Content” or the “Comparison” layout for its side-by-side content placeholders. A screen reader will read the entire first column before reading the second column.
Title each slide
This title will appear in the Outline panel. Screen reader users can navigate from slide to slide. The title placeholder is the first thing the screen reader will find in a standard layout . Because of this, it is as useful as assigning heading levels.
If a title clutters the slide without offering significant value to sighted users, make the title of that slide invisible:
- In the Home tab, under the Drawing group, click Arrange
- At the bottom of the drop down menu, click Selection Pane
- The Selection Pane will open at the right side of the PowerPoint window. This pane lists each placeholder or object in the current slide’s layout. Title will be at the bottom of the list.
- Click the icon that looks like an eye to the right of Title. The title will disappear from the slide, but remain visible in the Outline. This means that a screen reader will still be able to encounter the title and announce it to the user.
Check reading order of each slide
Use the Selection Pane to make sure the reading order of each slide is correct. When the order is correct, it appears backwards.
- The title placeholder is at the bottom and is read first
- The second content placeholder will appear above the title and read second
- The reading order continues up the list until the top placeholder, Slide Number, which is read last
- To adjust the reading order, select the placeholder that is out of place and use the up and down arrows near the top right of the Selection Pane to move it to the correct location in the reading order. Or, drag and drop the placeholders into the correct location.
Keep visuals simple and clear
Color Contrast
Make sure the text in your presentation has enough contrast with the background. Download a free Color Contrast Analyzer or access an online Google Chrome: Color Contrast Analyzer plugin.
Motion, blinking, transitions and animations
Content that blinks or flashes can be a serious issue for accessibility. Anything that flashes or blinks more than three times a second can trigger seizures in people with photosensitive epilepsy.
Use animations and transitions only when it is the best way to show an interaction or process that you need to cover in your presentation. Animations and transitions can be distracting to people with cognitive impairments.
Images, charts and graphs
You must add alt text to images in your PowerPoint slides.
The process is very similar inserting alt text in a Word document.
- Right click on the picture you wish to add alt text to and select Format Picture
- A Format Pane will open on the right side of the window. At the top of the pane, click the icon for Size and Properties
- Select the Alt text tab
- Two fields will display: Title and Description. Leave Title blank, as this information is not conveyed to assistive technology
- In the Description field, enter your brief alt text
Charts and graphs
Charts, graphs and other complex images may contain too much information for alt text.
If possible, simplify your charts or split them into two or more smaller charts. This will make the information more understandable to everyone in your audience. It will also allow you to use the alt text field to describe the charts.
If simplifying is not an option, you will need to provide a text description of the chart elsewhere. One place to do this is in the Notes section of the slide. Then, put "Full text description located in the Notes section of this slide" in the alt text field.
When creating graphs pay attention to color contrast. Make sure your graphs are readable from a distance.
Adding alt text to charts and graphs
- Right click on the chart or graph you wish to add alt text to and select Format Chart Area
- A Format Pane will open on the right side of the window. At the top of the pane, click the icon for Size and Properties
- Select the Alt text tab
- Two fields will display: Title and Description. Leave Title blank, as this information is not conveyed to assistive technology
- In the Description field, enter your brief alt text
SmartArt graphics
As with charts, graphs and images, SmartArt Graphics require alt text in order to be read by a screen reader. To insert alt text for a SmartArt Graphic:
- Right click the background of the placeholder containing the SmartArt Graphic. Choose, Format Object
- A Format Pane will open on the right side of the window. At the top of the pane, click the icon for Size and Properties
- Select the Alt text tab
- Two fields will display: Title and Description. Leave Title blank, as this information is not conveyed to assistive technology
- In the Description field, enter your brief alt text
- Click on the first individual shape in the graphic. The Alt text tab will remain open, but the title of the pane on the right will change to “Format Shape”. The alt text description will be blank
- Enter the alttext for just that one shape
- Continue through the graphic, one shape at a time, until you have entered all the text shown for each graphic
Tips for creating accessible graphs
-
Make sure your graph contains enough contrast
-
Darken & thicken lines on a graph so they can be seen from a distance
-
If individual data points need to be highlighted, make them larger so they will stand out.
-
Use font that is large enough (18pt+) to be seen from the rear of a lecture hall
These adjustments will make your graphs accessible to those with low vision. They will also ensure everyone attending your live presentation can see and understand your slides.
Video and Audio
- Video content must include synchronized captions and a rich description of the visuals
- Audio content must have a transcript available
- It is often a good idea to host the multimedia content on the web, such as YouTube (which offers auto captioning), and link it into your presentation
Tables
-
Using a standard layout, click on the Insert Table option in the content placeholder. The ribbon at the top of the PowerPoint window will open the Table Tools, Design tab.
-
A data table must contain column headers, row headers, or both. If your table will have column headers, be sure the Header Row option is checked in the “Table Style Options” group. If your table will have row headers, be sure the “First Column” option is checked. If your table will have both column and row headers, check both options.
-
Set the text, background, banding patterns, and grid colors for the table under the “Table Style Options” and "Table Styles" groups.
-
When selecting these options, ensure there is enough contrast between text and background.
-
Choose a table style that provides grid lines to clearly separate data cells. People viewing the slide through a screen magnifier will be able to use the grid lines to follow each row and column across the page.
-
Use simple data tables. Don't merge or split cells. Don’t leave columns or rows blank; this is an indication to screen reader users that the table has ended.
-
Accessibility Checker
The accessibility checker provided in PowerPoint can help you find some types of accessibility issues.
To check the accessibility of your PowerPoint:
- Select the File tab from the top left of the PowerPoint window
- Under the Info tab click the Check for Issues button. A drop down menu will appear. Select “Check Accessibility”
- An Accessibility Checker Pane will appear on the right side of the screen, displaying a list of errors found, along with instructions on how to fix them